Data Viz
Disable Highlight
Thursday, December 18, 2014
Thursday, July 3, 2014
Tuesday, June 24, 2014
Tableau 8.2 makes its debut
Lets see whats stored in us with Tableau 8.2
Highlights
Tableau 8.2 - Data to the MAC
Story telling
Visual Data Window
Story telling
Visual Data Window
Connection Improvements with Google Big Query , Excel ,Text Files ,etc
Performance Improvements to Tableau Server
REST API
Performance Improvements to Tableau Server
REST API
Story Telling
Lets try to tell stories with our Data
Visual Data Window
Better and efficient way of writing the queries

Rest API
What are the Possibilities with REST API
Sign In
Query Data sources
Create Project , Update Project , Delete Project
Add users to site, Remove users from site, Delete users to site
Create Site, Delete Site , Update Site
Set Favorites ,Delete Favorites
Query Views and Get thumbnail preview
Friday, May 30, 2014
Tableau Tip : Using Refresh embedded parameter
In the recent project I've been focusing a lot on live connections to MySQL to replace some existing internal dashboards with more insightful ones. The great thing about our MySQL environment is that it's super fast and I can turn around a dashboard built on a template in less than an hour.
The users complained saying dashboards with live connections are not showing the latest data. Why? Tableau is using the cache (as it should).To solve this, all I have to do is force the dashboard to refresh every time the user hits the server. I accomplish this by adding the ":refresh" parameter to the URL. My URL now looks like:
https://[TableauServerURL]/views/[WorkbookName]/[ViewName]?:embed=y&:toolbar=no&:refresh
The refresh option on the end is what tells Tableau Server to re-render the view.
https://[TableauServerURL]/views/[WorkbookName]/[ViewName]?:embed=y&:toolbar=no&:refresh
The refresh option on the end is what tells Tableau Server to re-render the view.
Monday, May 26, 2014
Thursday, May 1, 2014
How to display Top N Rows , when connected to cubes
My data source is cubes, I am able to get the top 20 rows and display them, But when i am trying to fill the color field tableau is again ranking the data based on color.
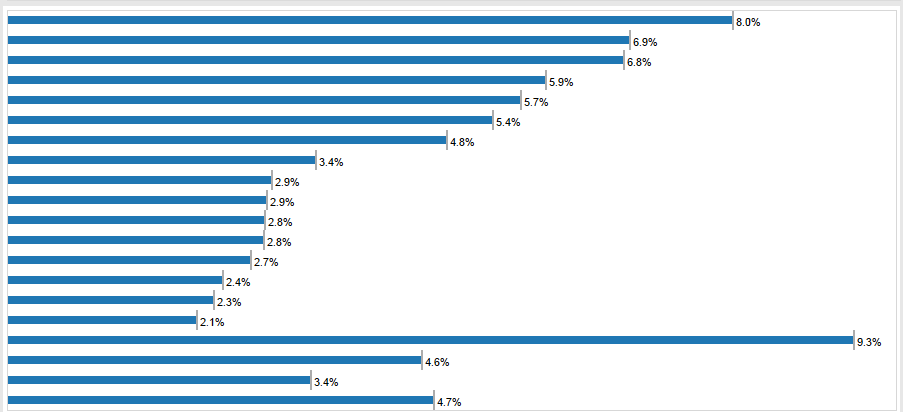
Here is the Pic showing with out adding color

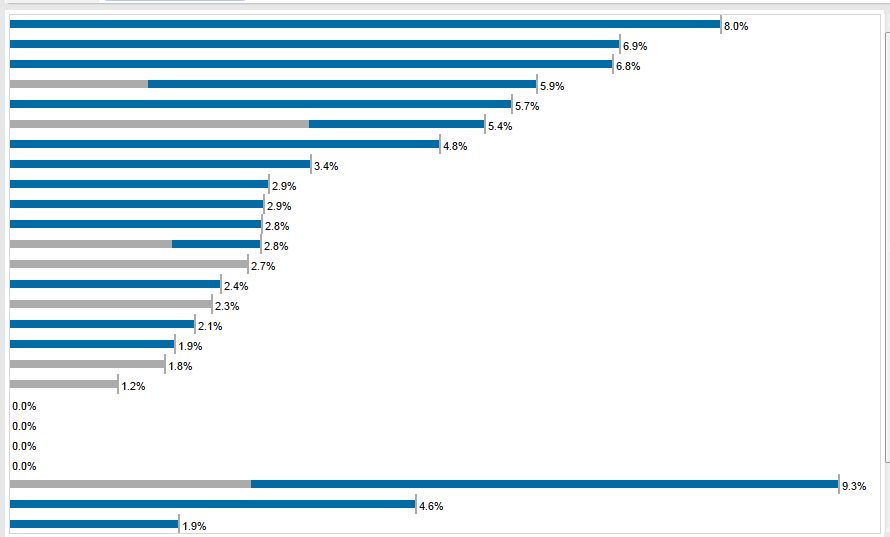
After dragging color to the view, the data now doesnt display the top 20 correctly it displays more than 20 rows, data get ranked again based on color.

After dragging color to the view, the data now doesnt display the top 20 correctly it displays more than 20 rows, data get ranked again based on color.
Steps to follow to display top N rows
- Create a calculated field called Index with the code Index()
- Place it on Rows, right click it and make it discrete. Then move it to the left of the dimension that's on Rows (since I don't know the name that dimension, I'll call the field RowDim)
- Right click Index and select "Edit Table Calculation". What you want is to get it so that the Index is calculated at the level of RowDim without Status playing a role in partitioning. So, select "Advanced" from the Compute Using drop down and move both RowDim and Status from Partitioning to Addressing with RowDim on top.
- Click OK and then on the first screen select RowDim from the "At the Level of" drop down and then click OK.
- Hopefully what you see is each row getting a proper sequential index. Assuming your view is sorted, the index should match the RowDim with the highest purchase price being 1 and then counting up.
- Right click the Index field and make it continuous (this is not entirely necessary, but will make the next step easier). You'll notice that it now moves to the right of RowDim. This is because Tableau always keeps discrete fields on Rows and Columns (which create headers) to the left of continuous fields (which create axes).
- Drag the Index field from Rows to Filters.
Wednesday, April 16, 2014
Collection of Maps use cases is a Single Tableau Workbook,Thanks to Shawn Wallwork for sharing this .
Credits :
TG = Team Geiger
JM = Joshua Milligan
SW = Shawn Wallwork
Click here
Subscribe to:
Comments (Atom)

