Disable Highlight

Friday, May 30, 2014

Tableau Tip : Using Refresh embedded parameter

In the recent project I've been focusing a lot on live connections to MySQL to replace some existing internal dashboards with more insightful ones. The great thing about our MySQL environment is that it's super fast and I can turn around a dashboard built on a template in less than an hour.

The users complained saying dashboards with live connections are not showing the latest data. Why? Tableau is using the cache (as it should).To solve this, all I have to do is force the dashboard to refresh every time the user hits the server. I accomplish this by adding the ":refresh" parameter to the URL. My URL now looks like:

https://[TableauServerURL]/views/[WorkbookName]/[ViewName]?:embed=y&:toolbar=no&:refresh

The refresh option on the end is what tells Tableau Server to re-render the view.

Monday, May 26, 2014

Thursday, May 1, 2014

How to display Top N Rows , when connected to cubes


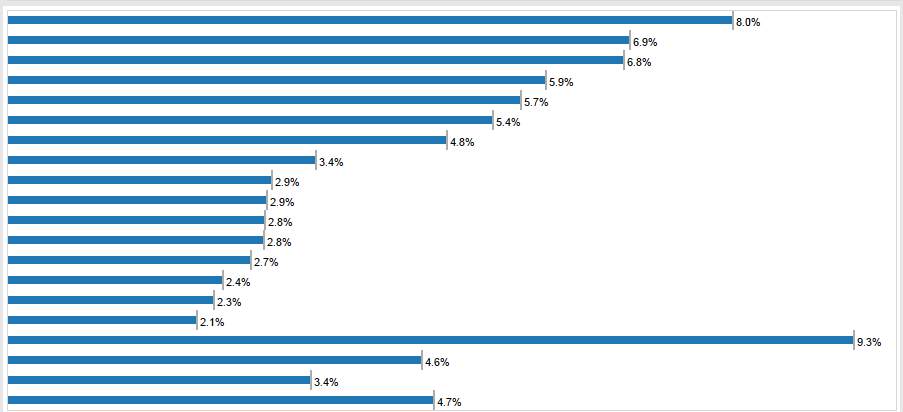
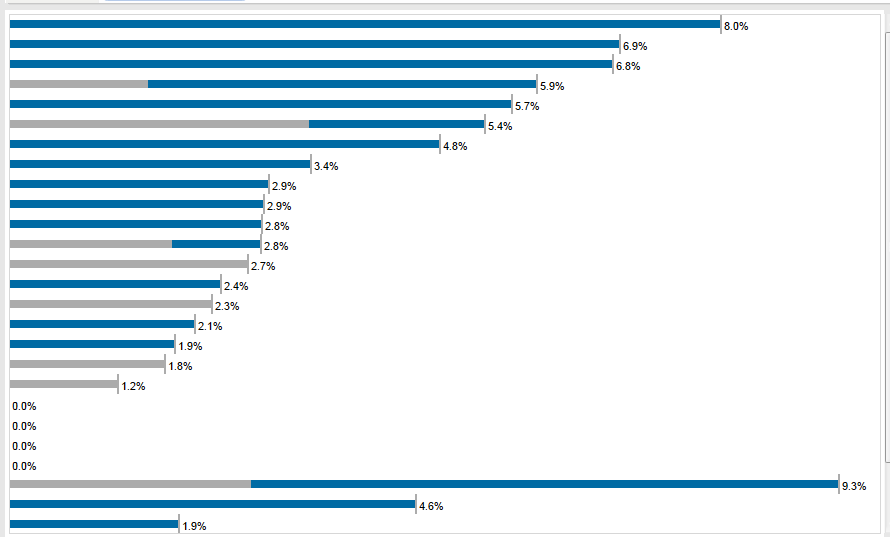
My data source is cubes, I am able to get the top 20 rows and display them, But when i am trying to fill the color field tableau is again ranking the data based on color.

Here is the Pic showing with out adding color


After dragging color to the view, the data now doesnt display the top 20 correctly it displays more than 20 rows, data get ranked again based on color.


Steps to follow to display top N rows


  • Create a calculated field called Index with the code Index()
  • Place it on Rows, right click it and make it discrete. Then move it to the left of the dimension that's on Rows (since I don't know the name that dimension, I'll call the field RowDim)
  • Right click Index and select "Edit Table Calculation". What you want is to get it so that the Index is calculated at the level of RowDim without Status playing a role in partitioning. So, select "Advanced" from the Compute Using drop down and move both RowDim and Status from Partitioning to Addressing with RowDim on top.
  • Click OK and then on the first screen select RowDim from the "At the Level of" drop down and then click OK.
  • Hopefully what you see is each row getting a proper sequential index. Assuming your view is sorted, the index should match the RowDim with the highest purchase price being 1 and then counting up.
  • Right click the Index field and make it continuous (this is not entirely necessary, but will make the next step easier). You'll notice that it now moves to the right of RowDim. This is because Tableau always keeps discrete fields on Rows and Columns (which create headers) to the left of continuous fields (which create axes).
  • Drag the Index field from Rows to Filters. 


Wednesday, April 16, 2014


Collection of Maps use cases is a Single Tableau Workbook,Thanks to Shawn Wallwork for sharing this .
Credits :
TG = Team Geiger
JM = Joshua Milligan
SW = Shawn Wallwork
Click here

Friday, April 4, 2014

Visualization Best Practices guide


1. Avoid the use of quick filters on dashboards to improve load times. Use cross tabs, heat maps and highlight table filters....sometimes pie charts work for this purpose as well.

2. Keep dashboards to 4 panes and imagine a Z pattern of importance from upper left to lower right.

3. Don't build grids or pivot-table-looking dashboards. Use visual analytics and bring details in on demand via filter actions, jump filters, annotation or customized tool tips.
4. Pimp your tool tips at the end. If you don't, you will create more work for yourself.

5. Use color sparingly and never more than 2 ways in a single dashboard. Preferably one.

6. Avoid pie charts for one to many comparisons.

7. Use bullet graphs or bar charts.

8. Don't repeat the same chart type in dashboards - it’s boring.

9. Leverage data blending for ad hoc analysis to add meaning and WOW factor.

10. Strive for a high data to ink ratio - eliminate color, shape, size or text that doesn't add information or is redundant.

Here is the link

Wednesday, April 2, 2014

Tableau Mobility : How can we do it ?

In Tableau, you do not have to do anything special to make a dashboard mobile. Simply publish to Tableau Server like you always have, and Tableau will detect if you’re using the Mobile app. You even get the native touch experience if you go to Tableau Server from your mobile browser, without the app at all.

Ease of use is the single most important aspect of mobile business intelligence. When you’re on the go, you need to be able to get to the data you need with a few taps.

Filters: Tableau’s controls such as filters, parameters, sliders, scrolling, and zoom & pan, are specially built to interact with your fingers. For example, tapping a filter pops a large, touch-optimized quick filter. And for long filters, there is scrolling inside the filter.

Views: Views themselves are touch-optimized with dynamic scrolling. Simply swipe to scroll through a long customers list, for example. Or pinch & zoom in a map.

The two major approaches for Mobility in Tableau


Security

Mobile business intelligence must be secure. With the Tableau mobile solution, security and metadata continues to be managed by Tableau Server. This means you can enforce your existing security protocols and integrate with ActiveDirectory via Tableau Server.

And if an employee loses their iPad or Android tablet, simply disable their Tableau Server account and give them a new one. No data other than descriptive data about a workbook (like the publisher, data modified and name) are stored on the device, so you can keep your data secure even while it’s mobile.

Tuesday, April 1, 2014

Using Desktop excel file as Live data Source for Tableau Server


Thanks Jonathan Drummey for the steps

The order of setting up a live Tableau Server connection to a file data source such as Excel, Access, or text file via a workbook (in other words, *not* using Tableau Data Server) is:

0) If Microsoft Office is not installed on Tableau Server and you are connecting to Excel or Access files, you will need a driver from the list in Drivers & Activation | Tableau Software. Note that this requirement will go away in many cases for Excel files in Tableau 8.2 that can use the new Excel connection type in 8.2.

1) Set up your Tableau Server so that the user Tableau Server runs as has access to wherever you are putting the Excel, Access, or text files to use as data sources.

2) In Tableau Desktop always use the UNC path like \\localhost\pathname rather than C:\pathname. If you didn't do that at the beginning, you can always edit the connection later, which is better than replacing the data source because if you do the latter then you'll lose colors & aliases.

3) When publishing to server, make sure you *uncheck* "Include External Files". If you don't do this, you'll be scratching your head later when the data doesn't update. If you didn't do step 2 or step 1, when you publish as Tableau is rendering the viz in the preview window Tableau will spit errors at you saying it can't display the viz. Note that Tableau only does that for the data sources required for the viz, so if you have data sources A and B, and the preview viz uses A but B isn't available, the publishing will work fine and you won't get the error until someone on Tableau Server tries to access a worksheet or dashboard that uses data source B.