Hello.
Today's use case is that I have a Text Table that has the names of people on the rows and dates on the columns and should be filtered by what activity we're looking at (the documents per hour, number of keystrokes, etc). It should show a shape or color based on thresholds for a particular activity.
The part that I'm having a problem with is creating calculated fields that would accept whatever activity currently selected by the filter and having thresholds for them.

Solution :
Step 1: Create a Parameter as shown below and select show parameter control
Step 2: Create a Calculated Field KPI Values as shown below
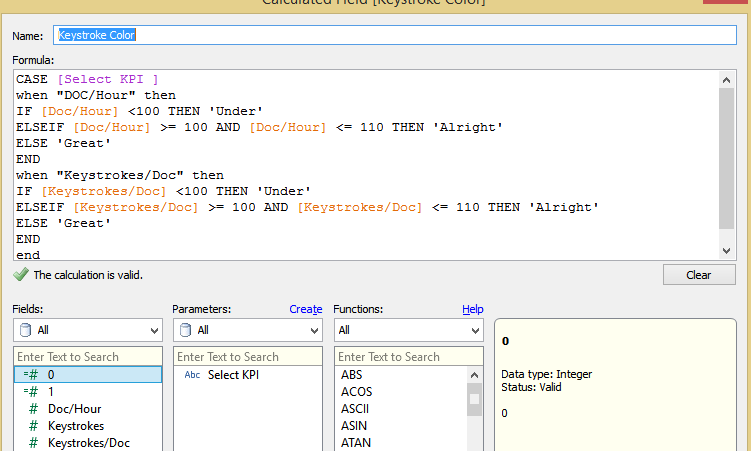
Step 3: Create a Calculated measure Key stroke color as shown below
Now drag the KPI Values to the Label field. , Key Stroke to the Shapes and assign the shapes for KPI as desired.
KPI DOC/Hour

KPI Keystrokes/DOC
The workbook pic
I am attaching the workbook with the solution here , Let me know if you face any problem viewing it.
You may need to change the thresholds based on your requirement , I just picked a random value.


No comments:
Post a Comment